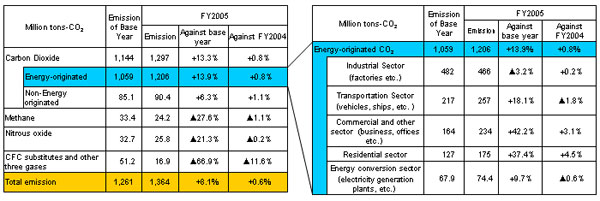
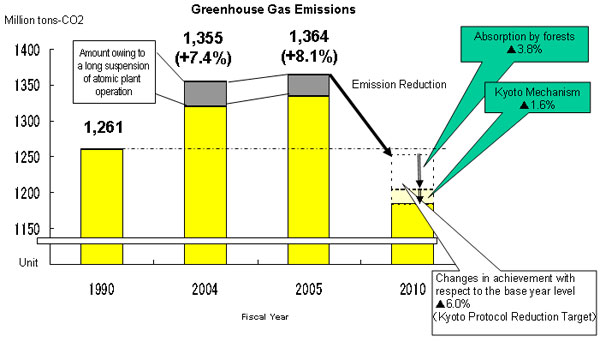
 |
Source: Compiled by the Agency for Natural Resources and Energy based on Handbook of Energy & Economic Statistics in Japan data
(Note 1) The Index of Industrial Production is weighted with value added structure (2000 standard).
(Note 2) The Index of Industrial Production is affected by sales values. When a sales price drops, the index may go below the index of production volume.
|
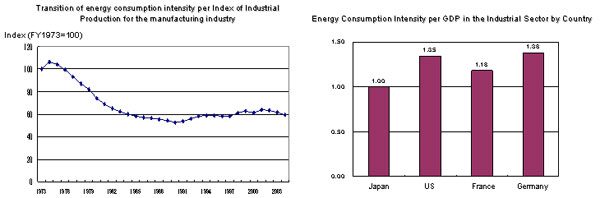
Source: Compiled by the Agency for Natural Resources and Energy based on Handbook of Energy & Economic Statistics in Japan data
(Note) Final energy consumption (tons in oil equivalent)/real GDP (1995 value in US$) (both are actual figures for FY2003), indicated in the ratio when the Japanese figure is set at 1.
|
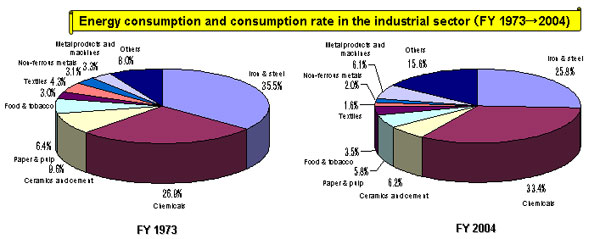
| I-2. Transition of Energy Consumption in the Industrial Sector Transition of the Energy Consumption Rate �in the Industrial Sector |
- Raw material industries, including iron & steel, chemicals, ceramics and cement, and paper & pulp, were major energy consumers (approximately 70%) in the industrial sector in FY 2004.
- The consumption rate of overall raw material industries decreased between 1973 and 2004, but the consumption rate of chemicals increased during the same period(26.8%→33.4%).
 |
| Source: Compiled by the Agency for Natural Resources and Energy based on the Handbook of Energy & Economic Statistics in Japan |
Copyright(C) ECCJ 1996-2007
|