AEEC Home | Training Index | Index | Top | Previous | Next

ECCJ / Text Indonesia

To reduce Amount of energy consumption and Energy cost,
* It can be managed,
by Factory total (whole factory) ---
by Process Line ---
by Facility (machine) individually ---
* Management in small unit (facilities/machines) is more suitable for improvement of energy intensity than in large unit (factory total).

* To be shown in Energy Intensity.
because, it is easier to evaluate the result of operational/technical improvement comparing with before-improvement.

“Energy Intensity” (or “energy unit consumption”)
As the management of energy, “Energy Intensity” is widely accepted.

The definition is:


“Energy Intensity” can be applied for “whole factory”, “individual process line”, “each machines”.

“Energy consumption amount” --- heat (J) and/or electric power (Kwh) (→ combined in crude oil equivalent) --- can be represented by individual particular unit --- steam: ton, water: m3, fuel: Kl etc.

“Production amount” --- unit: weight (tonnage), number of products, treated area(m2), working time (h), etc.

Example: energy intensity of boiler
A) The condition of boiler operation
a. steam production rate (without electric generation) 4,090 ton per month
b. fuel consumption rate (LHV=41.7 GJ/k-litter) 300 kl per month (bunker-C)
B) Calculation
energy intensity of boiler = fuel consumption / steam production = 300,000 l / 4,090 ton
= 73.3 l-Bunker-C / t-Steam = 3.06 GJ / t-Steam
the price of Bunker-C is 34,000 Yen / kl, shown by energy cost : 2,492 Yen / t-Steam
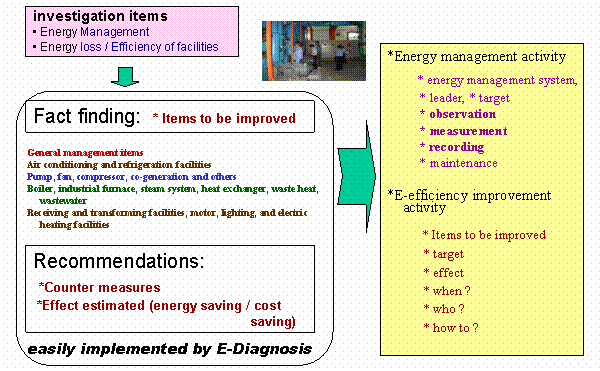
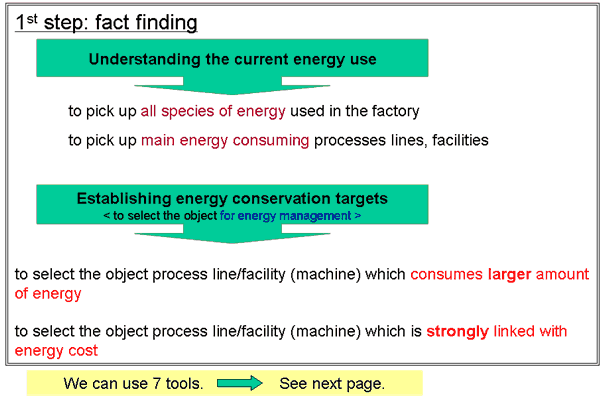
Energy Diagnosis is very effective for energy management and improvement.

What’s 7 tools ?
Elementary technique for improvement, based on statistical science
  1. Cause-effect diagram (Fish bone chart): to search out and organize all possible factors
  2. Control graph (with control level, upper / lower control limit ):to investigate whether a process is stable or not
  3. Stratification (Classification): to separate data by characteristics
  4. Histogram: to understand the form of a distribution, and compare it to a standard
  5. Pareto diagram: to get a handle on the real problem from among many
  6. Scatter-plot graph (Correlation graph): to find the correlation between a paired data
  7. Check sheet: to take down data simply and prevent inspection omissions (or 7. Flow diagram)
7 Tools had been originally developed for QC circle activity for data analysis.
7 Tools are very useful for solving other kinds of management subjects as well as QC .
 
Achieving energy management

5/26
Next
AEEC Home | Training Index | Index | Top | Previous | Next
Copyright(C) ECCJ 1996-2019