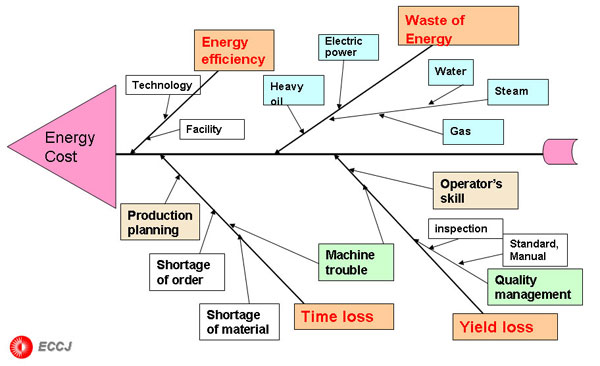
Example: Factor analysis for Energy Cost
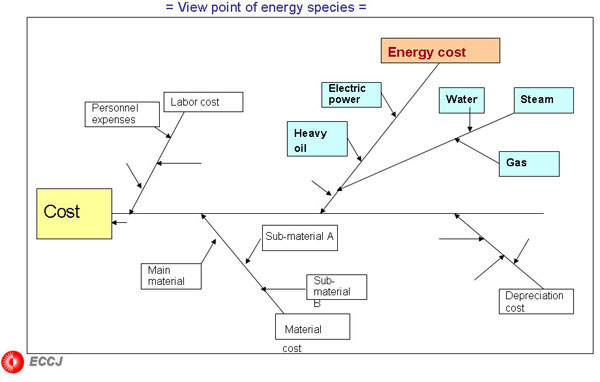
< cause and effect diagram >
< cause and effect diagram >
| AEEC Home | Training Index | Index | Top | Previous | Next |
| ECCJ / AOTS Malaysia training course | Malaysia |
|
How to find out targets (matters) should be managed
Example : Factor analysis
< cause and effect diagram "fish bone chart" > --- 7tools |
|
Example: Factor analysis for Energy Cost
< cause and effect diagram > |
|
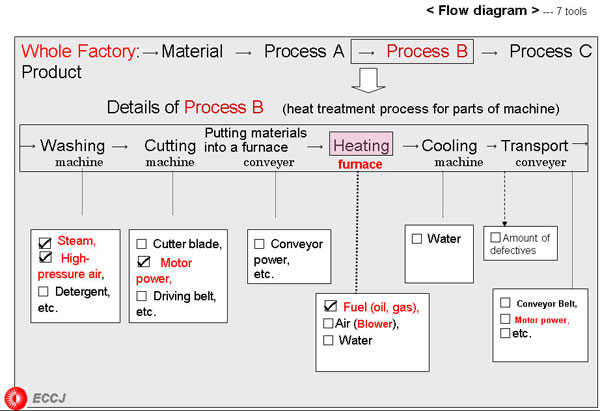
| Example : Machine manufacturing factory : (Schematic Diagram of Manufacturing Process) |
|
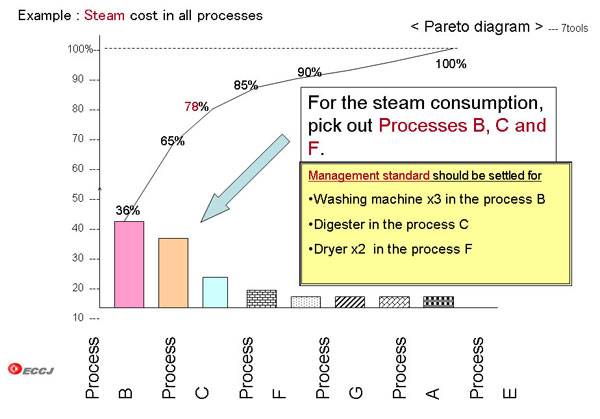
| Example : Steam cost in all processes |
 |
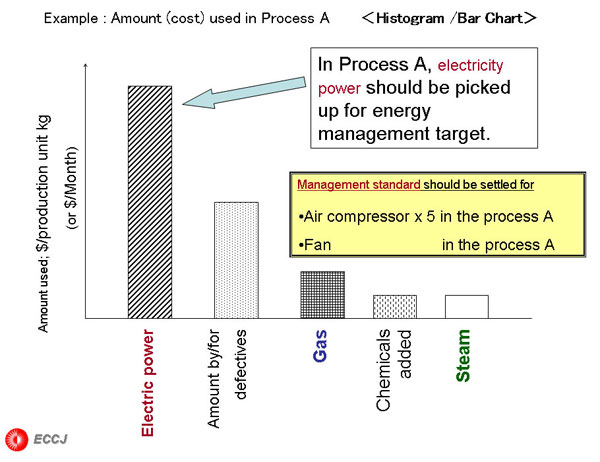
| Example : Amount (cost) used in Process A |
|
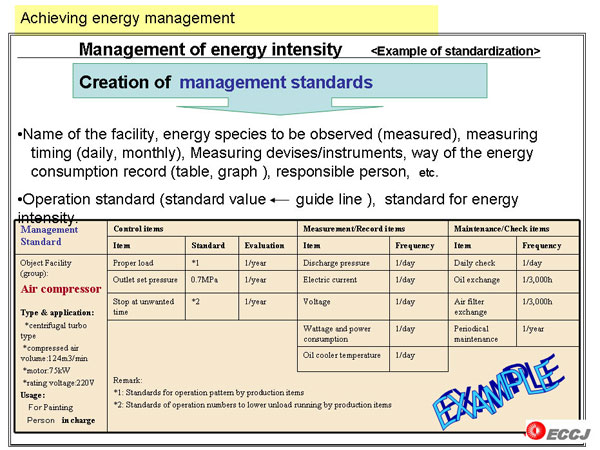
| Achieving energy management |
 |
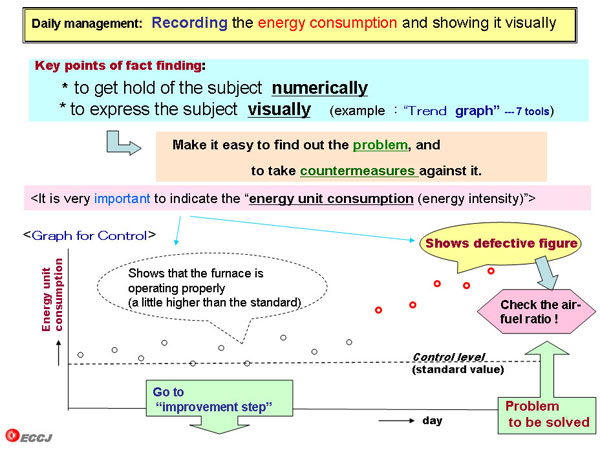
| Daily management: Recording the energy consumption and showing it visually |
 |
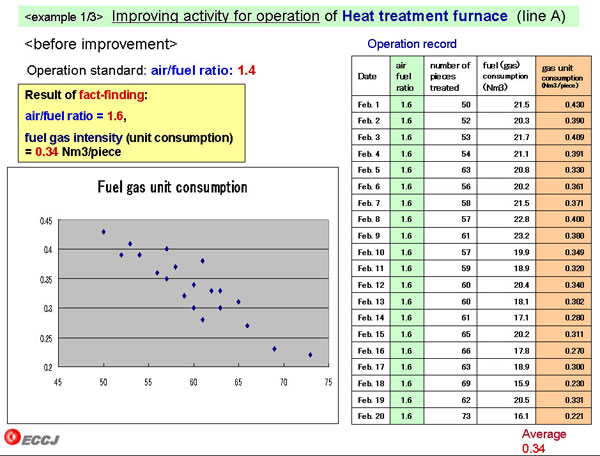
| < example 1/3> Improving activity for operation of Heat treatment furnace (line A) |
 |
| 3/8 Next |
| AEEC Home | Training Index | Index | Top | Previous | Next |
|
Copyright(C) ECCJ 1996-2019
|