Flow Chart of
Energy Management and Improvement Activity
| AEEC Home | Training Index | Index | Top | Previous | Next |
| METI / ECCJ / ACE Training Program MTPEC05 (2006.08) |
Flow Chart of
Energy Management and Improvement Activity |
|
To reduce Amount
of energy consumption and Energy cost, |
| * It can be managed, by Factory total (whole factory) --- by Process Line --- by Facility (machine) --- * Management in small unit (facilities/machines) is more suitable for improvement of energy intensity than in large unit (factory total). * To be shown in Energy intensity. because, it is easier to evaluate the result of operational/technical improvement comparing with before-improvement. |
“Energy
intensity” (or “energy unit consumption”) |
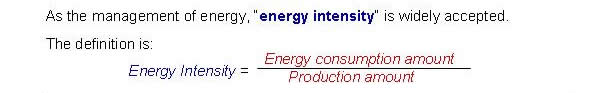
“Energy intensity” can be applied for “whole factory”, “individual process line”, “each machines”. “Energy consumption amount” “Production amount” --- unit: weight (tonnage), number of products, treated area(m2), working time (h), etc.
Example: energy intensity of boiler |
Achieving energy
management |
 We can use 7 tools.→See next page. |
| 4/37 Next |
| AEEC Home | Training Index | Index | Top | Previous | Next |