AEEC Home | Training Index | Index | Top | Previous | Next

METI/ECCJ/AOTS Training Program Indonesia

I-1. Overall Status
Comparison of Energy Consumption against GDP
by Country
  • Japan has a low rate of unit energy consumption per GDP compared to other industrialized nations.
primary energy consumption (tons in oil equivalent)GDP(one thousandU.S.$)when the Japanese figure is set at 1
(source: IEA Energy Balance 2004)

1-1Overall Status
Rising Crude Oil Dependency on Middle East Countries
  • The rate of crude oil dependency on middle east countries has largely surpassed the rate at the time of the oil crises. 77.5% (First oil crisis) 85.3% (FY2002)

1-1Overall Status
The Amount of CO2 Emitted from Energy Utilization in Japan
  • The COP3 (the 3rd Conference of Parties of UN Framework Convention on Climate Change) held in December 1997 agreed on the the reduction targets of GHG emission assigned to each developed country and issued its agreement as the "Kyoto Protocol". Japan is responsible for reducing 6% of the total GHG at the average value in 2008 to 2012 in comparison with 1990s. (US= -7%, EU= -8%)
  • About 90% of Japan's greenhouse gasses is energy-originated CO2.

*Difference between reduction target during the first commitment period stipulated in the Kyoto Protocol and the actual value during the same period is to be addressed by the Kyoto Mechanism.(Based on the projection of emission levels of each GHG with the effectiveness by existing measures, the difference is expected to be 1.6%)

1-2. Transition of Energy Consumption in the Industrial Sector
Transition of Energy Consumption in the Industrial Sector
  • Energy consumption in the industrial sector has been generally steady since oil crisis.
  • Energy consumption unit per industrial production index for the manufacturing industry suffered a sharp fall through to the 1980s, but has been on a trend of slight increase since the 1990s.
  • Japan's energy consumption unit against GDP in the industrial sector is lower than those of other major countries.
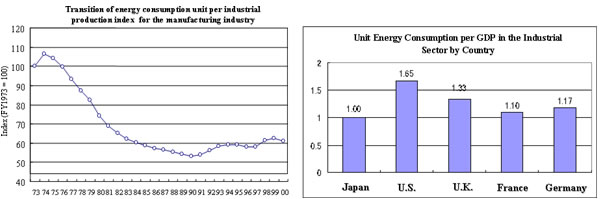
(Source) General energy statistics,
annual report on industrial indices
Note 1: The industrial production index
is weighted with value added structure
(1995 standard).
Note 2: Since the industrial production
index is affected by sales values, when a sales price drops, the index may go below
the index of production volume.
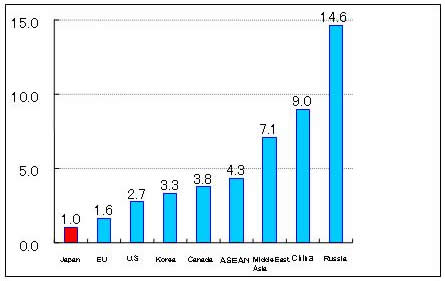
*Final energy consumption (tons in oil equivalent)
/ real GDP (1995 value in US$)
(both are actual figures for FY2000),
indicated in the ratio
when the Japanese figure is set at 1.
Source: Compiled by the Natural Resources and Energy Agency based on energy & economic statistics data

2/10
Next
AEEC Home | Training Index | Index | Top | Previous | Next
Copyright(C) ECCJ 1996-2019