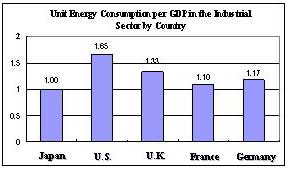
Comparison of Energy Consumption against GDP by Country
- Japan has a low rate of unit energy consumption per GDP compared to other industrializednations.
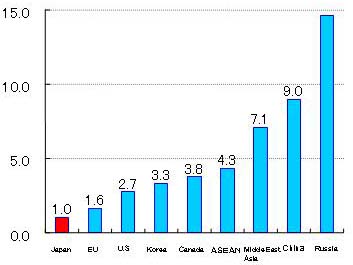
primary energy consumption (tons in oil equivalentj/fco(one thousand U.S.$)when the Japanese figure is set at 1
(source : IEA Energy Balance 2004)