Shape of Office Buildings and Actual Energy Consumption
 As the size of office buildings increase, area ratio with buildings other than general offices (e.g. shops) increases, and a diversification of types is being seen. The graph below shows area percentage and percentage of energy consumption per type using a model for a general office building of roughly 35,000 m2 in a metropolitan area.
Percentage of Area Per Type
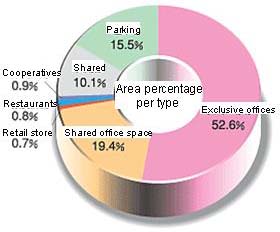 One index that describes the shape of office buildings is the rentable ratio (rented floor space/total floor space). The rentable ratio for office buildings shown in the graph is 52.6% (62.2% if parking is subtracted from the total floor space) and from a general standpoint, is quite large. In other words, the building in this model represents a general office building. On the other hand, large scale office buildings such as designated manufacturing plants are starting to become multipurpose with a large percentage of stores etc.
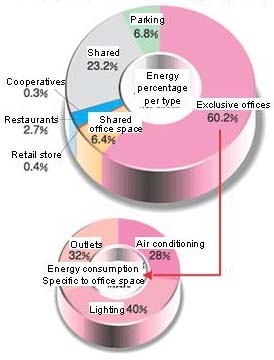
 n energy management for a building, it is important to understand "where", "when", "how much", and "what for" for the consumption of the energy. In other words, understanding of actual conditions is the first step in energy conservation. Therefore, data obtained through investigation was analyzed based on an "energy consumption structure" concept.
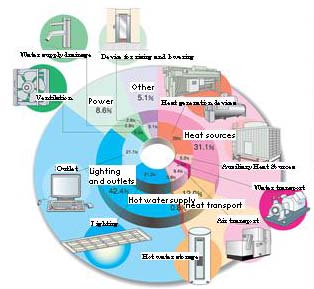 Note) the energy consumption structure described above is an example of a tenant building with a rentable ratio of greater than 60% (with heat sources).